In this article, I will give a brief overview of the features and capabilities of Tradingview.
Tradingview is a browser-based charting platform and screener for cryptocurrencies and other financial assets. Besides that, you can share trading strategies, live stream analysis, and much more.
My name is Leo; I am an entrepreneur and have been fully deep-diving into the crypto space for more than a year since my first contact with bitcoin in 2013. I love to try new things, learn and teach. That's what I am doing here.
In this guide, I will cover
- What Tradingview is
- Understanding the Tradingview User Interface
- How much does Tradingview cost
- How to use Tradingview
Let's not lose any time and directly jump into the topics.
What is Tradingview?
TradingView was founded in Westerville, Ohio, in 2011. Today it has its headquarters in New York, United States.
They have around 250 people employed worldwide—thirty million monthly visits and over 8.000.000 customs scripts and ideas shared by users.
TradingView offers tools for people who are just beginning but also for advanced traders. You can start with the free plan and use most of the features for free.
You do not need to download any software to get started, even though apps are available for iOS and Android and a desktop app for macOS.
Besides the option to create and customize your charts and use customized technical indicators to analyze financial assets, you can also use social features and test ideas of other users or follow their live stream. You can also implement your strategies in Pinescript and backtest them.
You have different markets available on Tradingview.
- Forex
- Futures
- Stocks
- Indices
- Bonds
- Cryptocurrency and more
Now you should know what Tradingview is about to do. Let's see how much it costs.
How much does Tradingview cost?
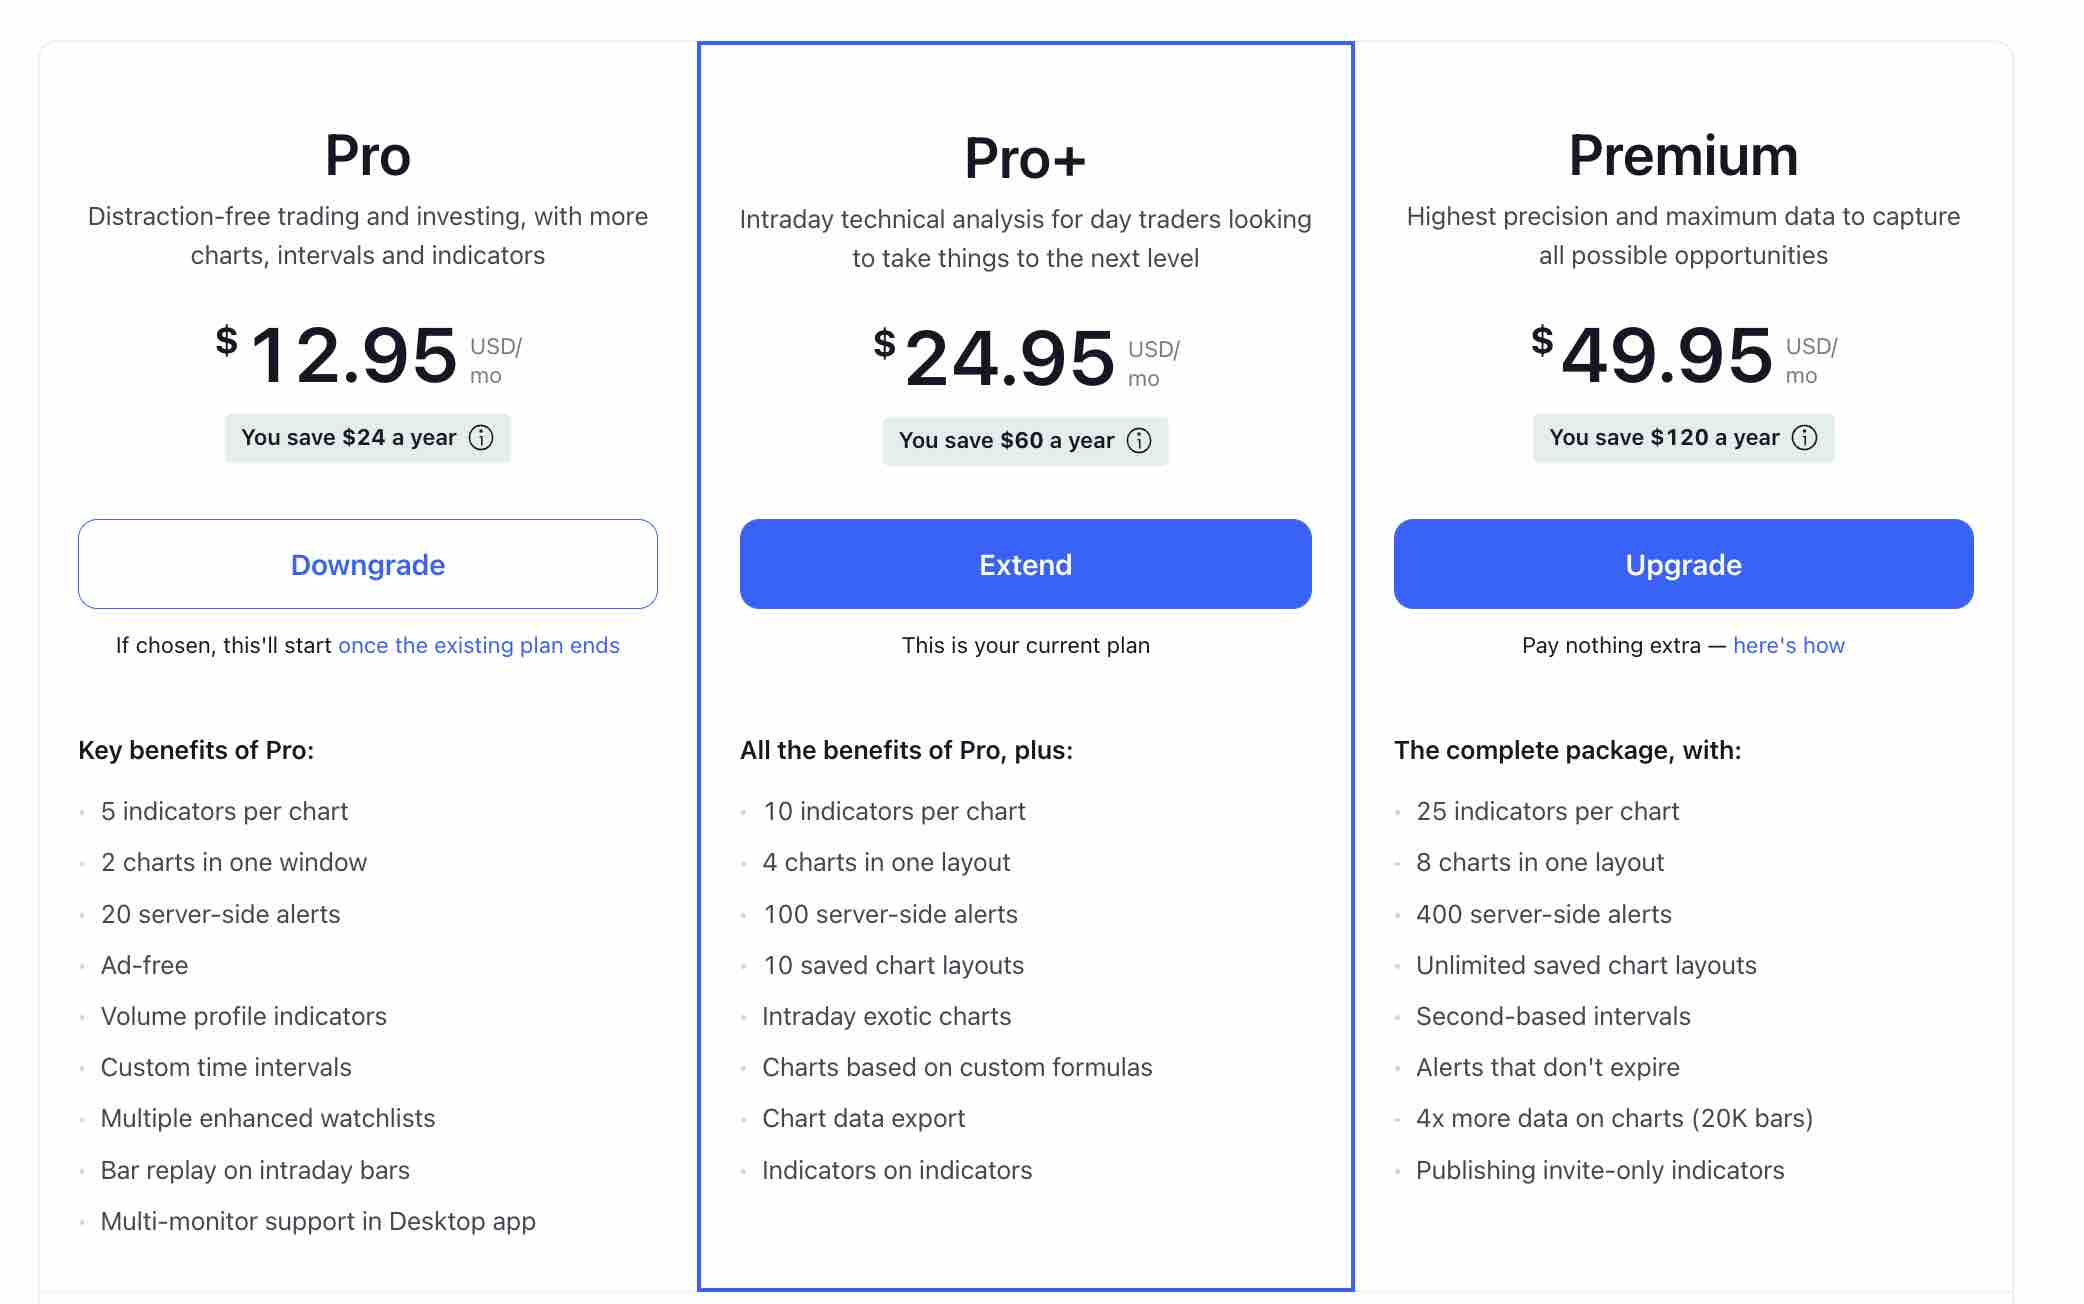
Here is an overview of what the different pricing plans can do for you. If you start, you do not have to pay for Tradingview; you have all the main functions available in the free version.
The complete feature comparison you can find on the Tradinview site.
The next step is to see and understand how the Tradinview Application is organized.
Understanding the TradingView User Interface
For beginners, the user interface might be overwhelming; that's why we will go through every area and explain the main features of each part. You will see everything is much easier as you might think.
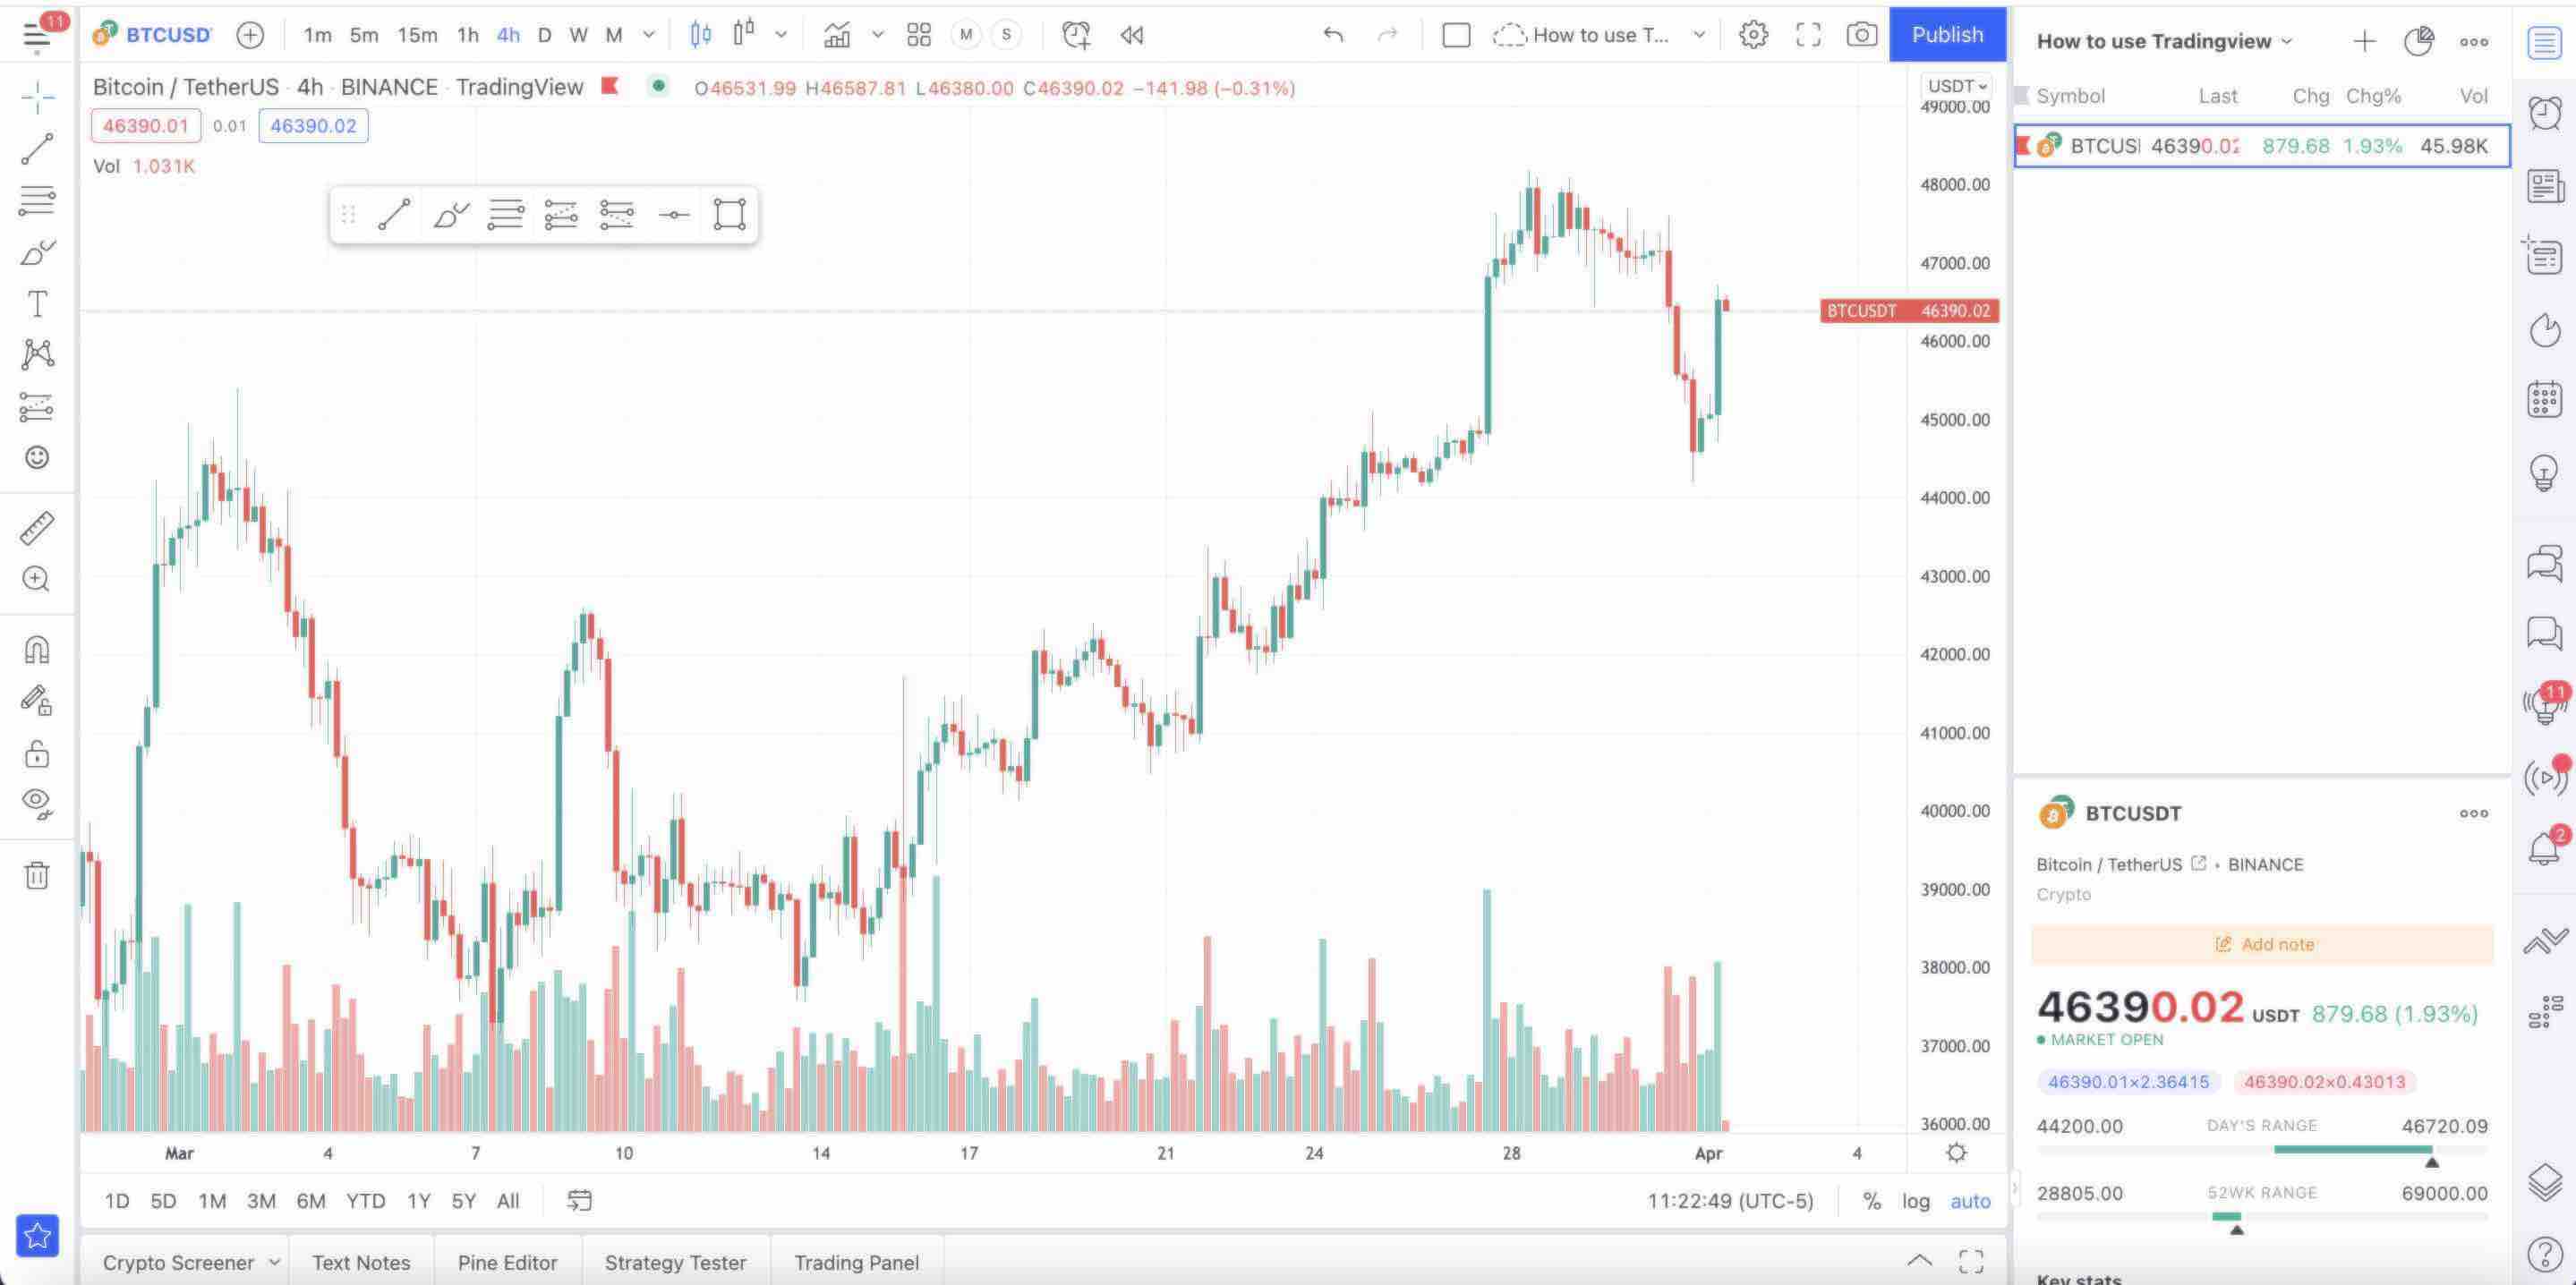
We split the User-interface into five sections the (1 green) Chart area, the (2 yellow) top spot, the (3 blue) left area, the (4 red) bottom area, and the (4 orange) right area.
1. Tradingview Chart Area (green)
In this part of the application, you see the price over time of the selected asset. This could be the price of a currency, a stock, a commodity, or a cryptocurrency. Some of them will also show in the chart window later on if we add indicators. In our example, we see the Bitcoin / Tether chart from Binance.
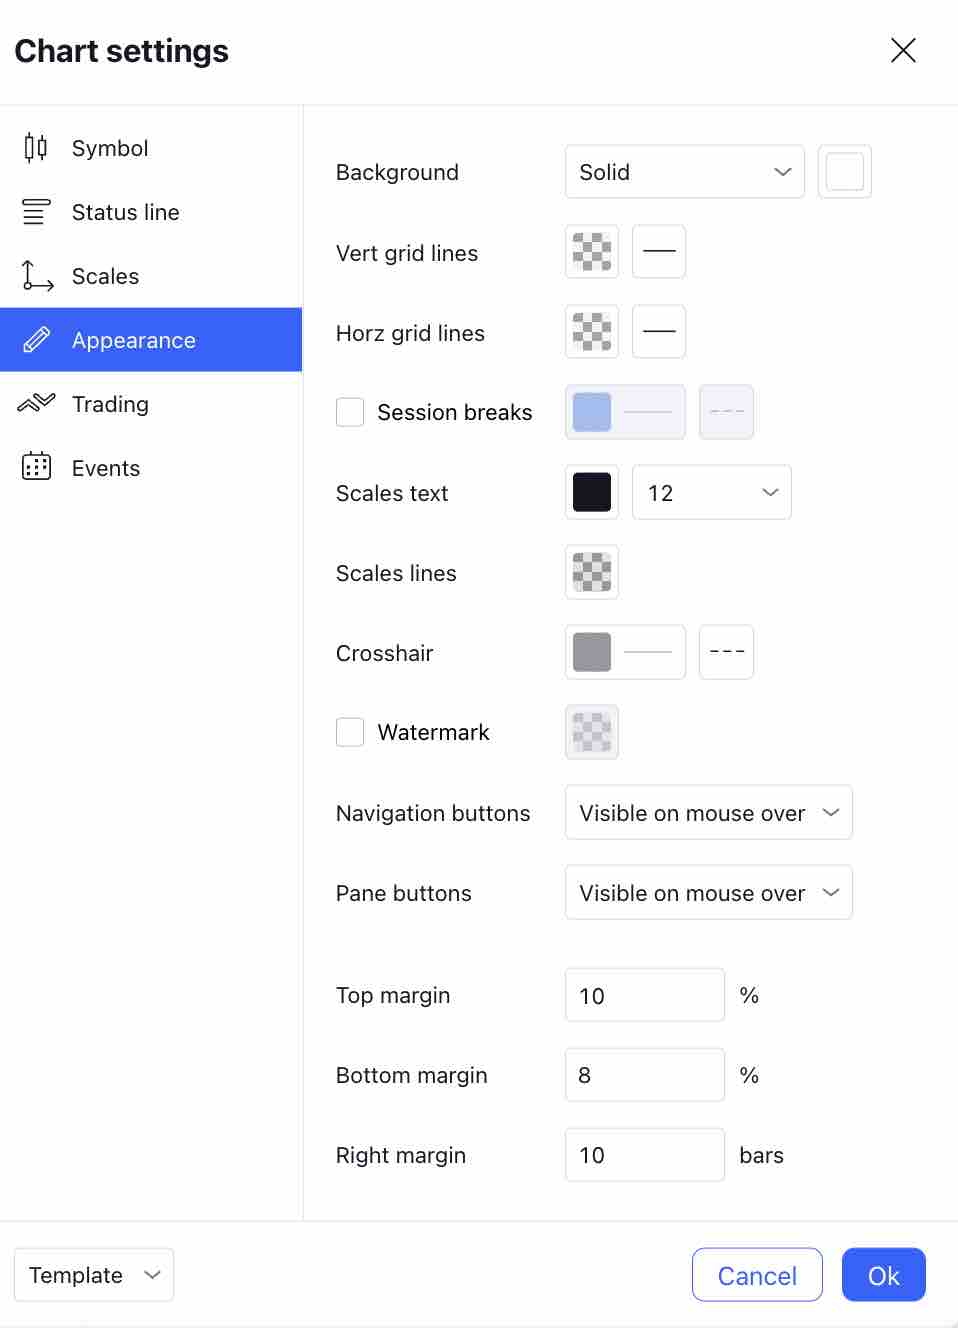
You can change the chart's settings by right-clicking in the chart area and, for example, choosing a different color theme for your charts.
2. Tradingview Top Menu (yellow)
You can set the time frame to see the chart in the top area. The timeframe ranges from 1 second to one month. Very commonly used time frames are 5 min to the daily or weekly timeframe, depending on what you want to do.
Another thing you can do in the top menu changes the appearance of the price. If you are trading, you probably do not want to use the line chart, but something more insightful related to the price action like a candlestick chart or Heikin Ashi candles. Those will give you more details on the price action that is happening.
You can also add your favorite indicators to your chart. Some examples are Moving Averages, Bollinger Bands, the RSI, or MACD. If all this sounds like a Spanish village to you, you can read my article about Crypto Indicators and Metrics for Beginners where I explain different indicators.
3. Tradingview Left Menu (blue)
In the left menu, you find a lot of different charging and drawing tools like
- simple and more complex trend and price lines
- trading tools like Fib Retracement
- painting tools like brushes, highlighters, rectangles
- annotation tools like text and symbols
- trading chart patterns like Elliot impulse waves, head, and shoulders
- tools to mark long and short positions, including the risk and reward ratios
- icons
- measuring tools
- and much more
In this Tutorial, we can not go into full detail, but more content will come around that topic in the future.
4. Tradingview Bottom Menu (red)
In the bottom menu, access your stock, forex, or crypto screener; you can take notes, write your own pine script in the Pine editor, backtest your strategy in the strategy tester or connect to your favorite broker and trade directly in the trading panel. You can also connect to a paper trading service.
The most famous crypto exchange and trading platforms you directly connect to are Gemini and FTX. FTX is also a newcomer and should be available soon.
A quite powerful menu, and each of them (maybe not the notes tab) is worth its own article (series).
5. Tradingview Right Menu (orange)
In the right menu, you can also do many different things.
First of all, you can set your customized watchlist of crypto assets; in our example, How to use Tradingview. You can create multiple lists, for example, for day trading, a watchlist, one for your swing trading, or a HODL portfolio.
You can also set and manage the alerts that you might set if, for example, your favorite cryptocurrency is breaking resistance levels. You can define how you want to be alert and your alert message. You can also choose how to be notified; options are notifications via app, pop-up, email, webhook URL, buy playing a sound, or SMS.
You can also scan the latest news related to a trading pair, check the economic calendar, write down trading ideas, chat with other platform users, check the idea stream or live trading streams of another user, etc.
Special Feature: Trading View Social Network
Trading view also comes with Instagram-like features. that make it possible to share your trading ideas and strategies and even go live and live trade.
Be careful with picking up trading ideas from others, always backtest ideas, and do your own research. If you want to learn and improve your skills, sharing your ideas and picking up ideas, and getting feedback is for sure a great idea to do so.
You can also directly chat with other users with the onboard chat functionality.
How to use Tradingview
It can be overwhelming, but I will run you through how you could get started with setting up your first chart.
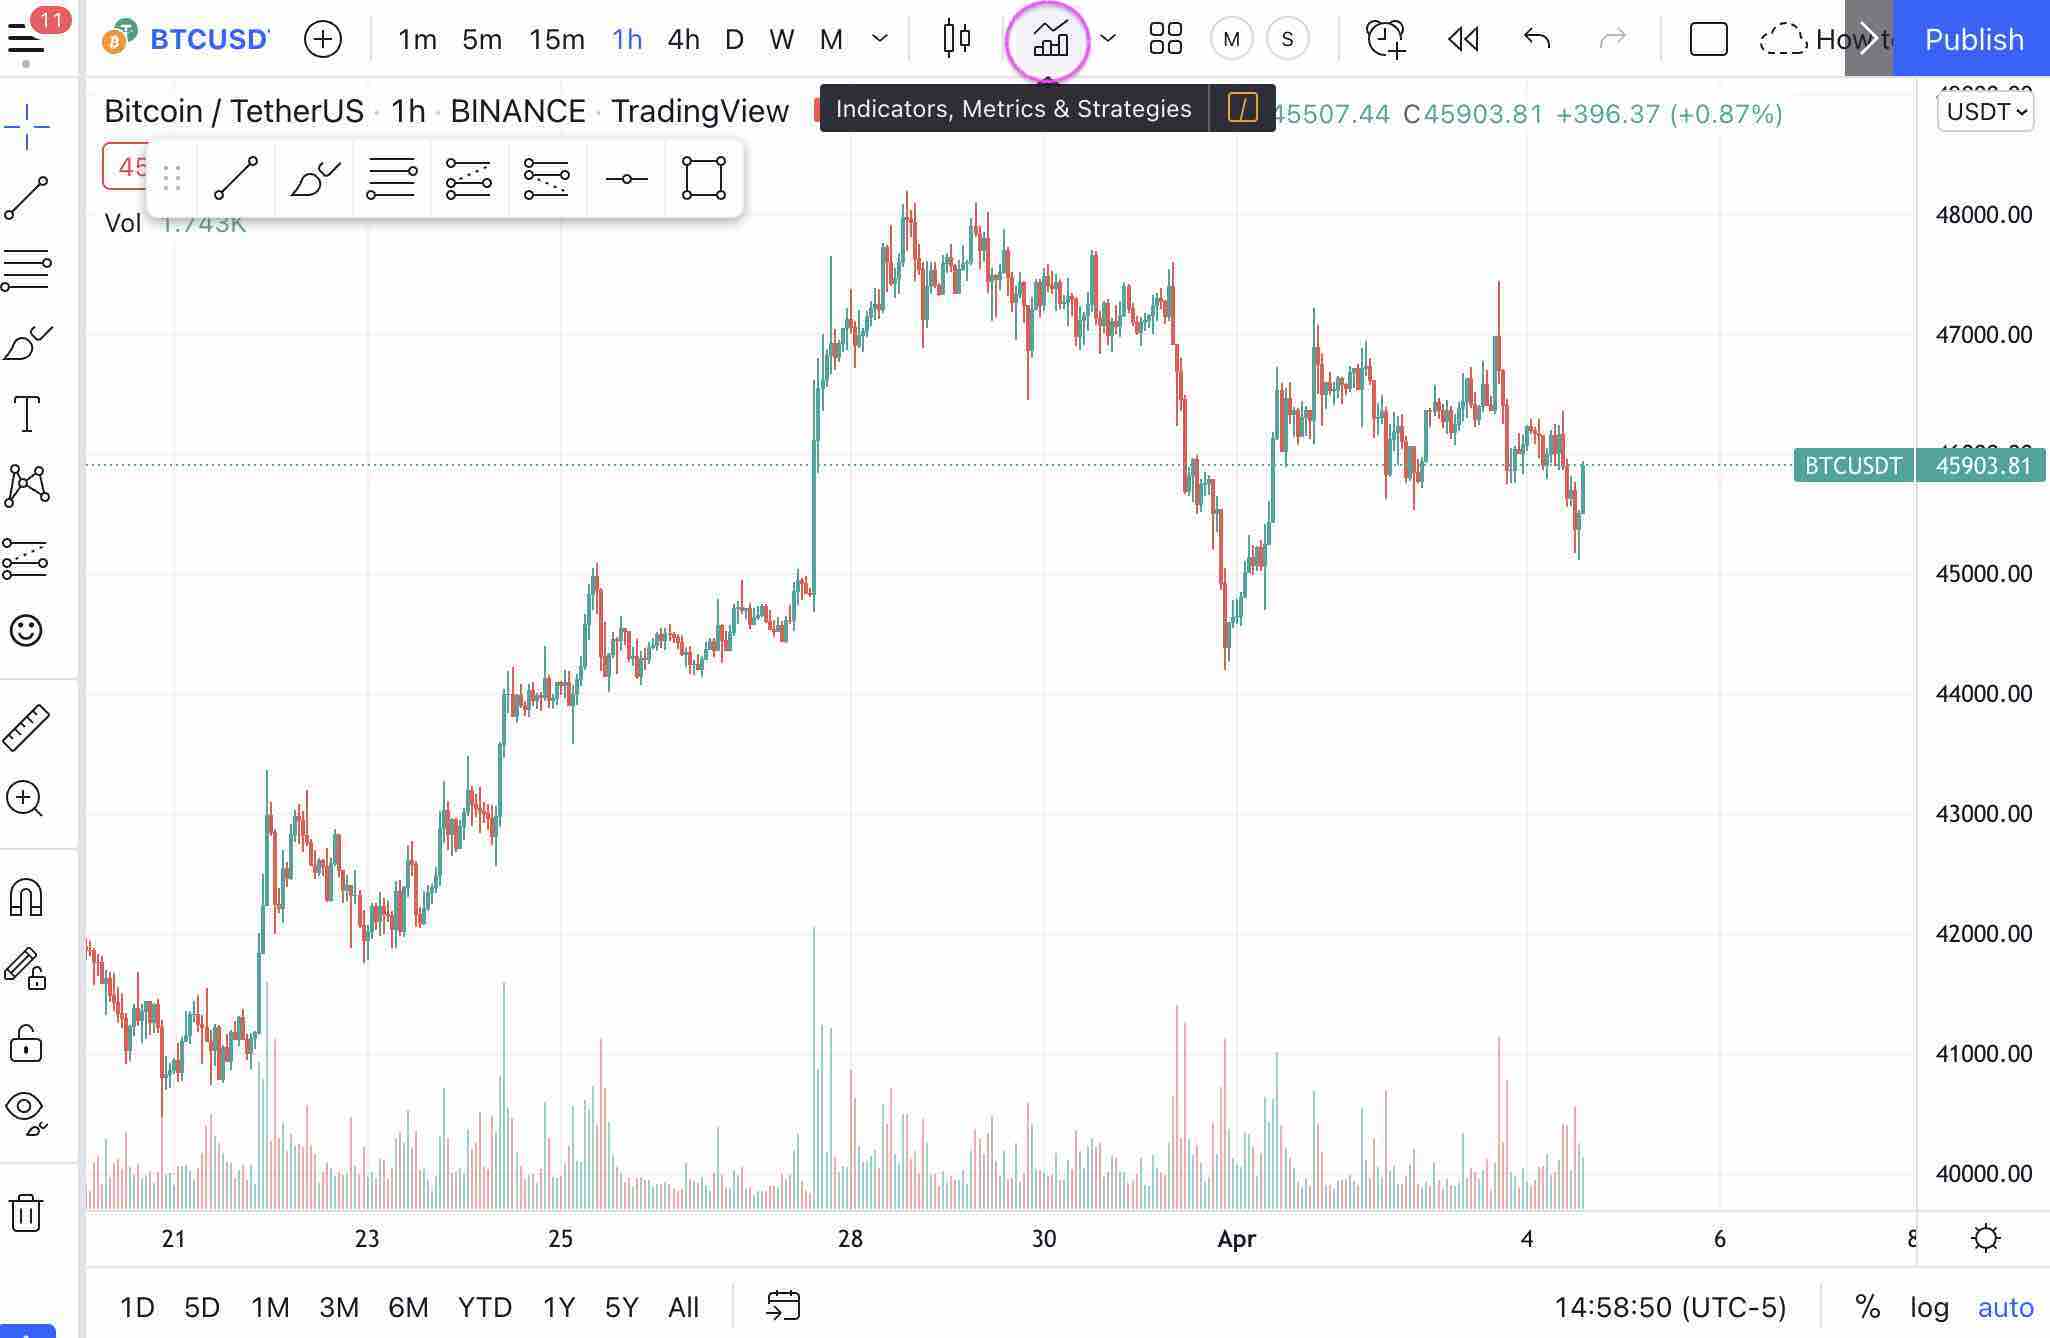
1. How to set up the BTC/USD Chart
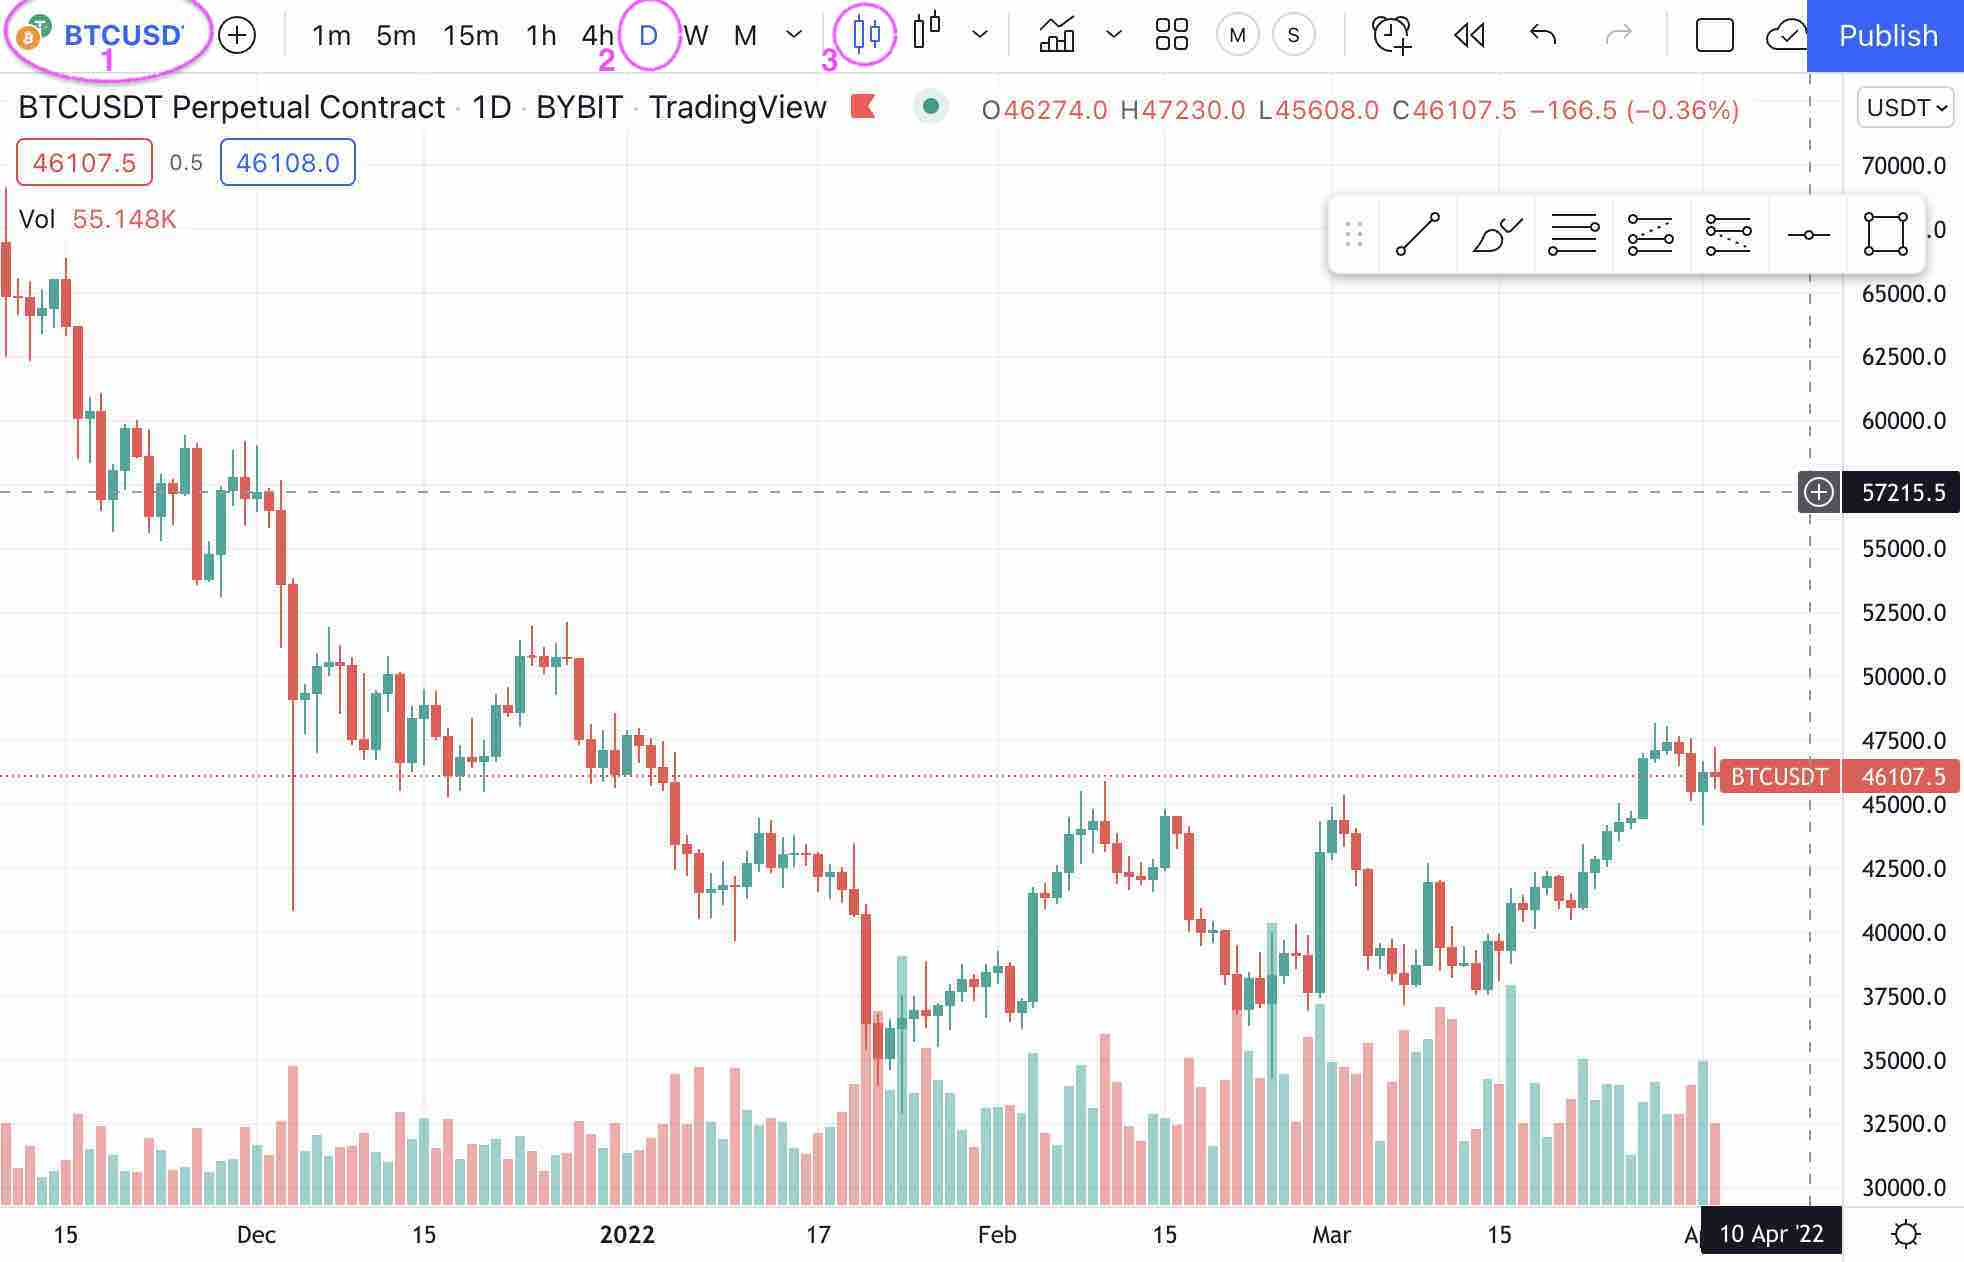
Here we are just setting up our favorite asset we want to trade in our chase BTCUSDT on KuCoin. I wrote an article What is bitcoin? if you want to learn more.
We are picking BTC/USD by clicking on the symbol indicated by 1; after that, you need to search for your asset and choose the item you want to track.
The next step is to choose a timeframe; as you see indicated by number 2, we are using the daily timeframe. I am using higher timeframes to get an idea of the current trend and for swing trading. For day trading or scalping, I am using smaller timeframes, for example, the 5min, 15min, or 1h timeframe. I try not to trade against the trend, and the trend can be confirmed in the higher timeframes.
In the next step (3), I choose to change the price action in the chat window from the line chart to Candles or Heikin Ashi to get more detailed price information.
If you want to change the general setting of your chart, you can click anywhere on the blank space in the chart window, right-click and select settings.
2. How to draw trend lines, support, resistance, and set alerts
If you are a more experienced trader, you will also have more advanced charts and would like to draw support and resistance levels in your chart. We will do that, and also we will be setting some alarms.
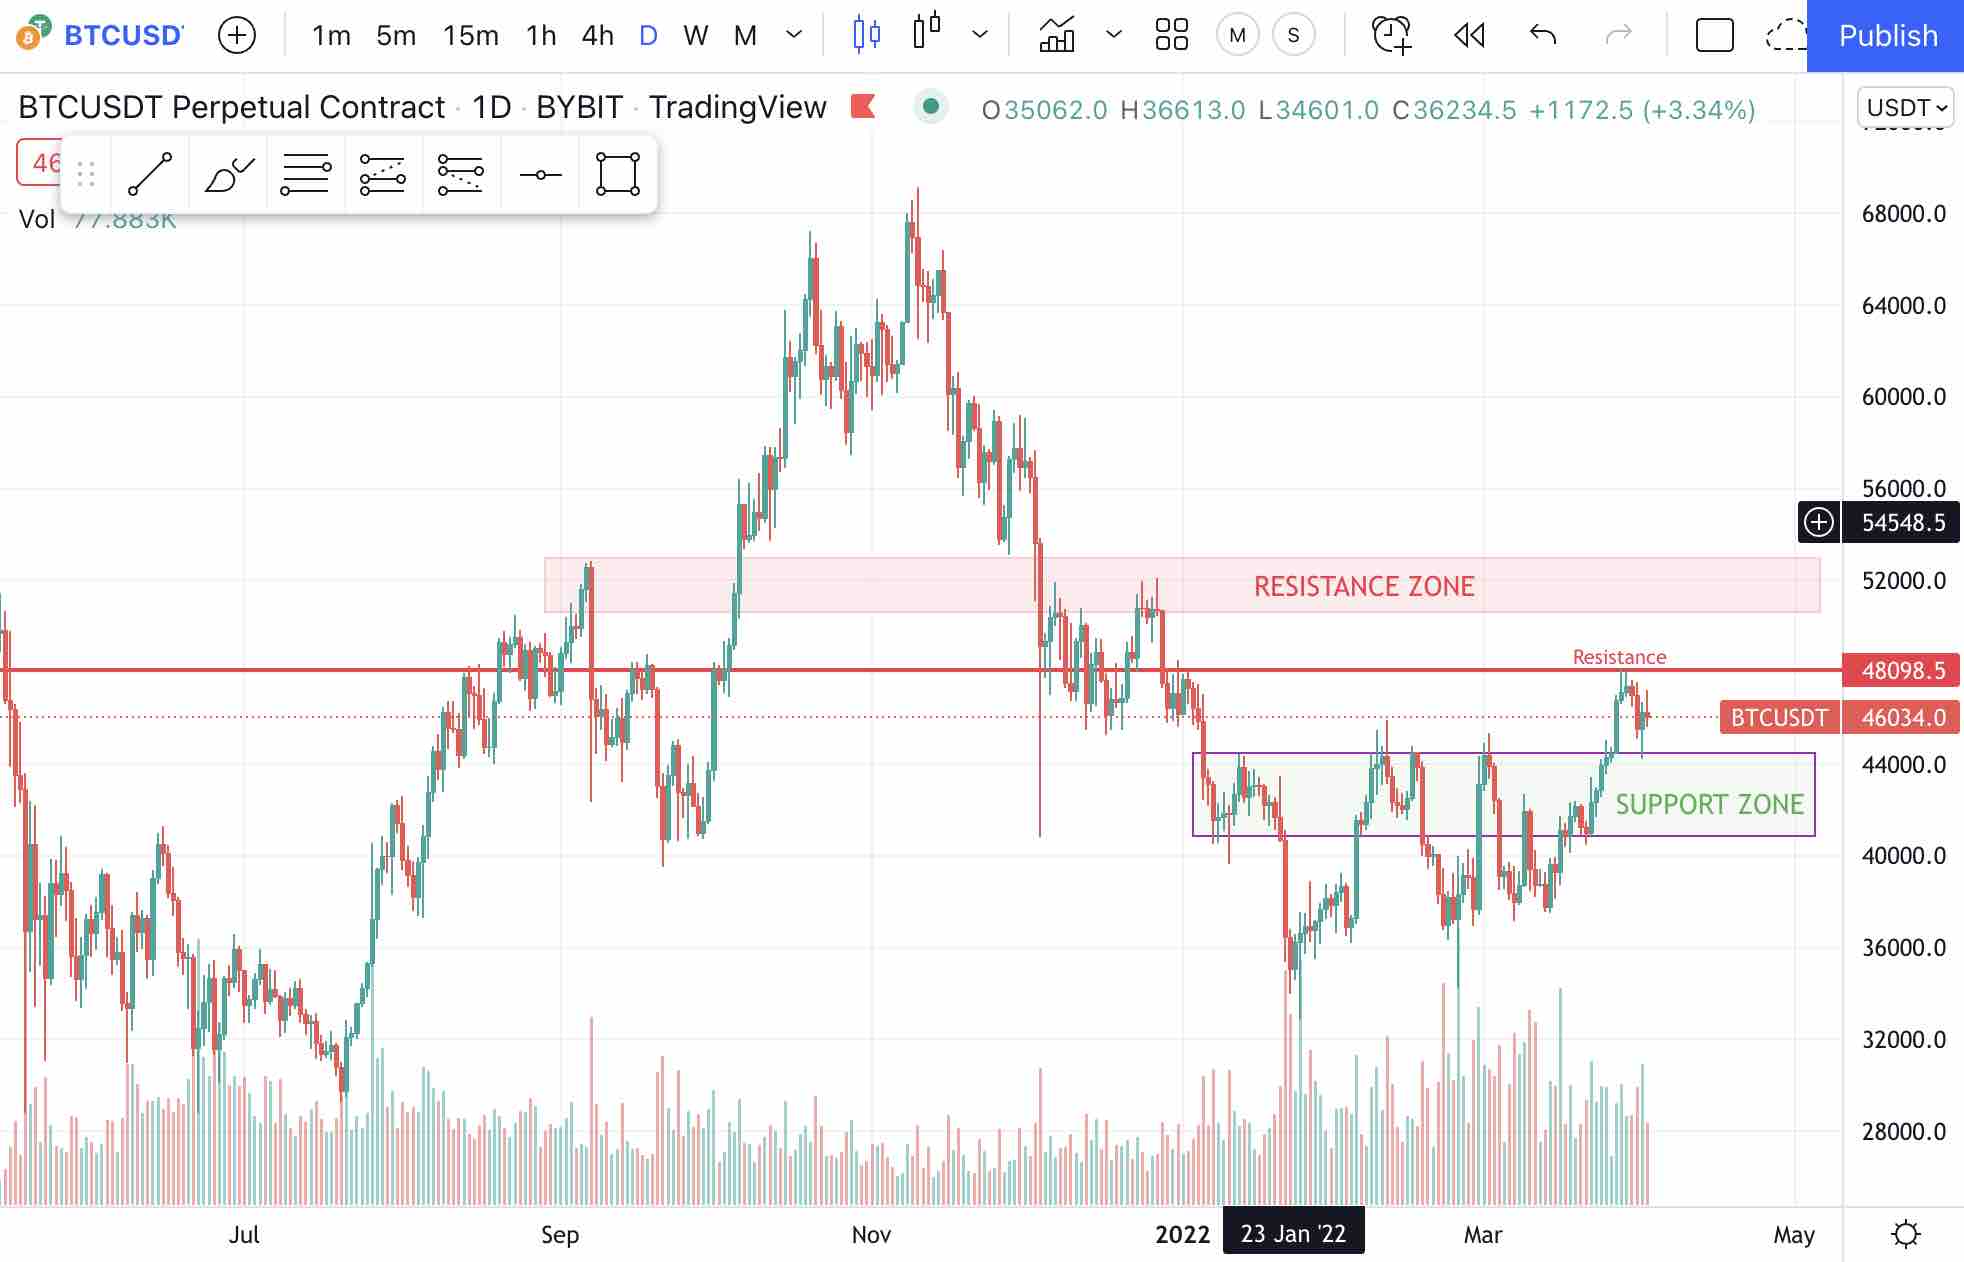
You can use the drawing tools in the left menu to add a support zone box, an immediate resistance level, the red resistance zone, whatever charting you want to do. You will see your lines and boxes also if you switch between timeframes. If you switch to another asset, you obviously have to draw your lines again.
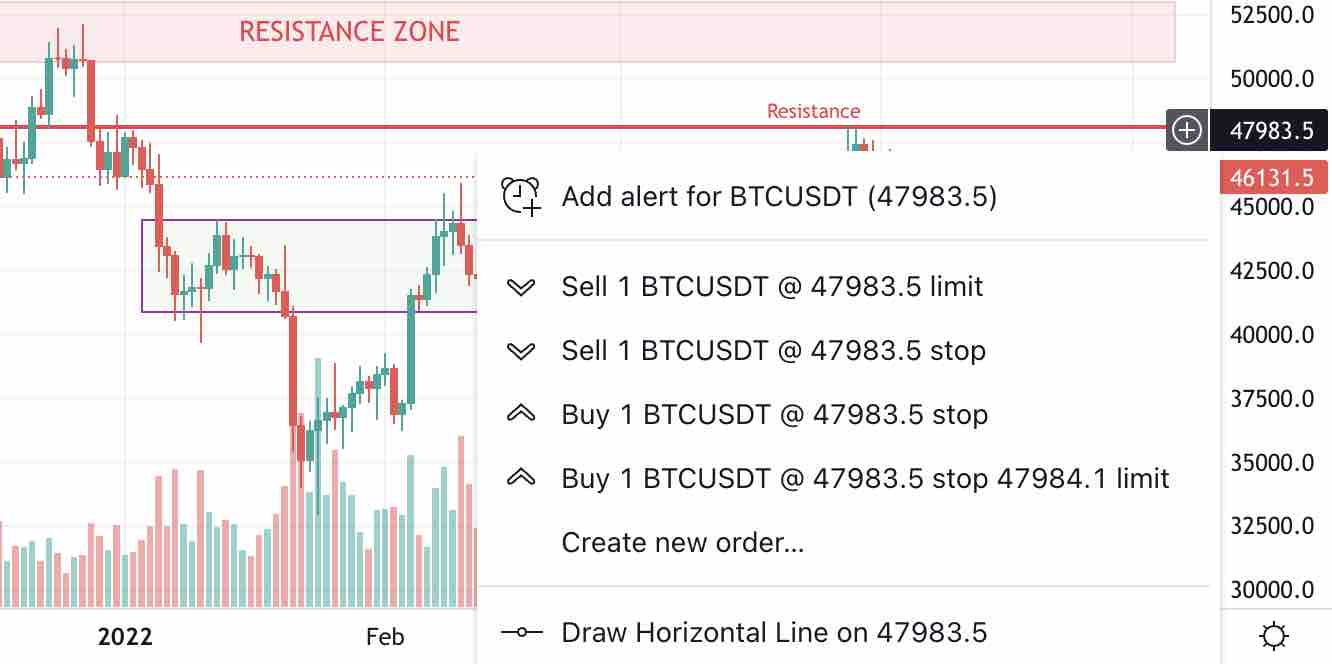
Another important feature is to set alarms. It's really easy to set an alarm, right-click on the chart, edit the price if needed and define a message. You can also choose how you want to be notified via app notification, as a pop-up, sound, email message, or webhook.
In this example, I want to be notified when we are coming closer to the bottom line of the support box to see if we are breaking further down or also when we are entering the resistance zone. If we break out of the resistance zone and it is confirmed, it will turn into our new support zone.
Obviously, you can do more things here, but for us, that's all we need for now. Let's have a look at indicators.
3. How to insert technical indicators
I wrote a whole article on Crypto Indicators and Metrics, have a look there if you want to learn more.
We will add the 50 and 200 moving average to our chart just for educational purposes. The moving averages are very straightforward tools in Technical Analysis. The 50 MA represents the average price over the last 50 units of time. If you are in the daily timeframe, the 50 MA is the average price for the last 50 days. A predefined set of indicators and the public library of 100.000+ community-built indicators are available in the free version. There is just a limitation on how many indicators per chart you can add.
Press the indicator button, type in the moving average, and choose your technical indicator.
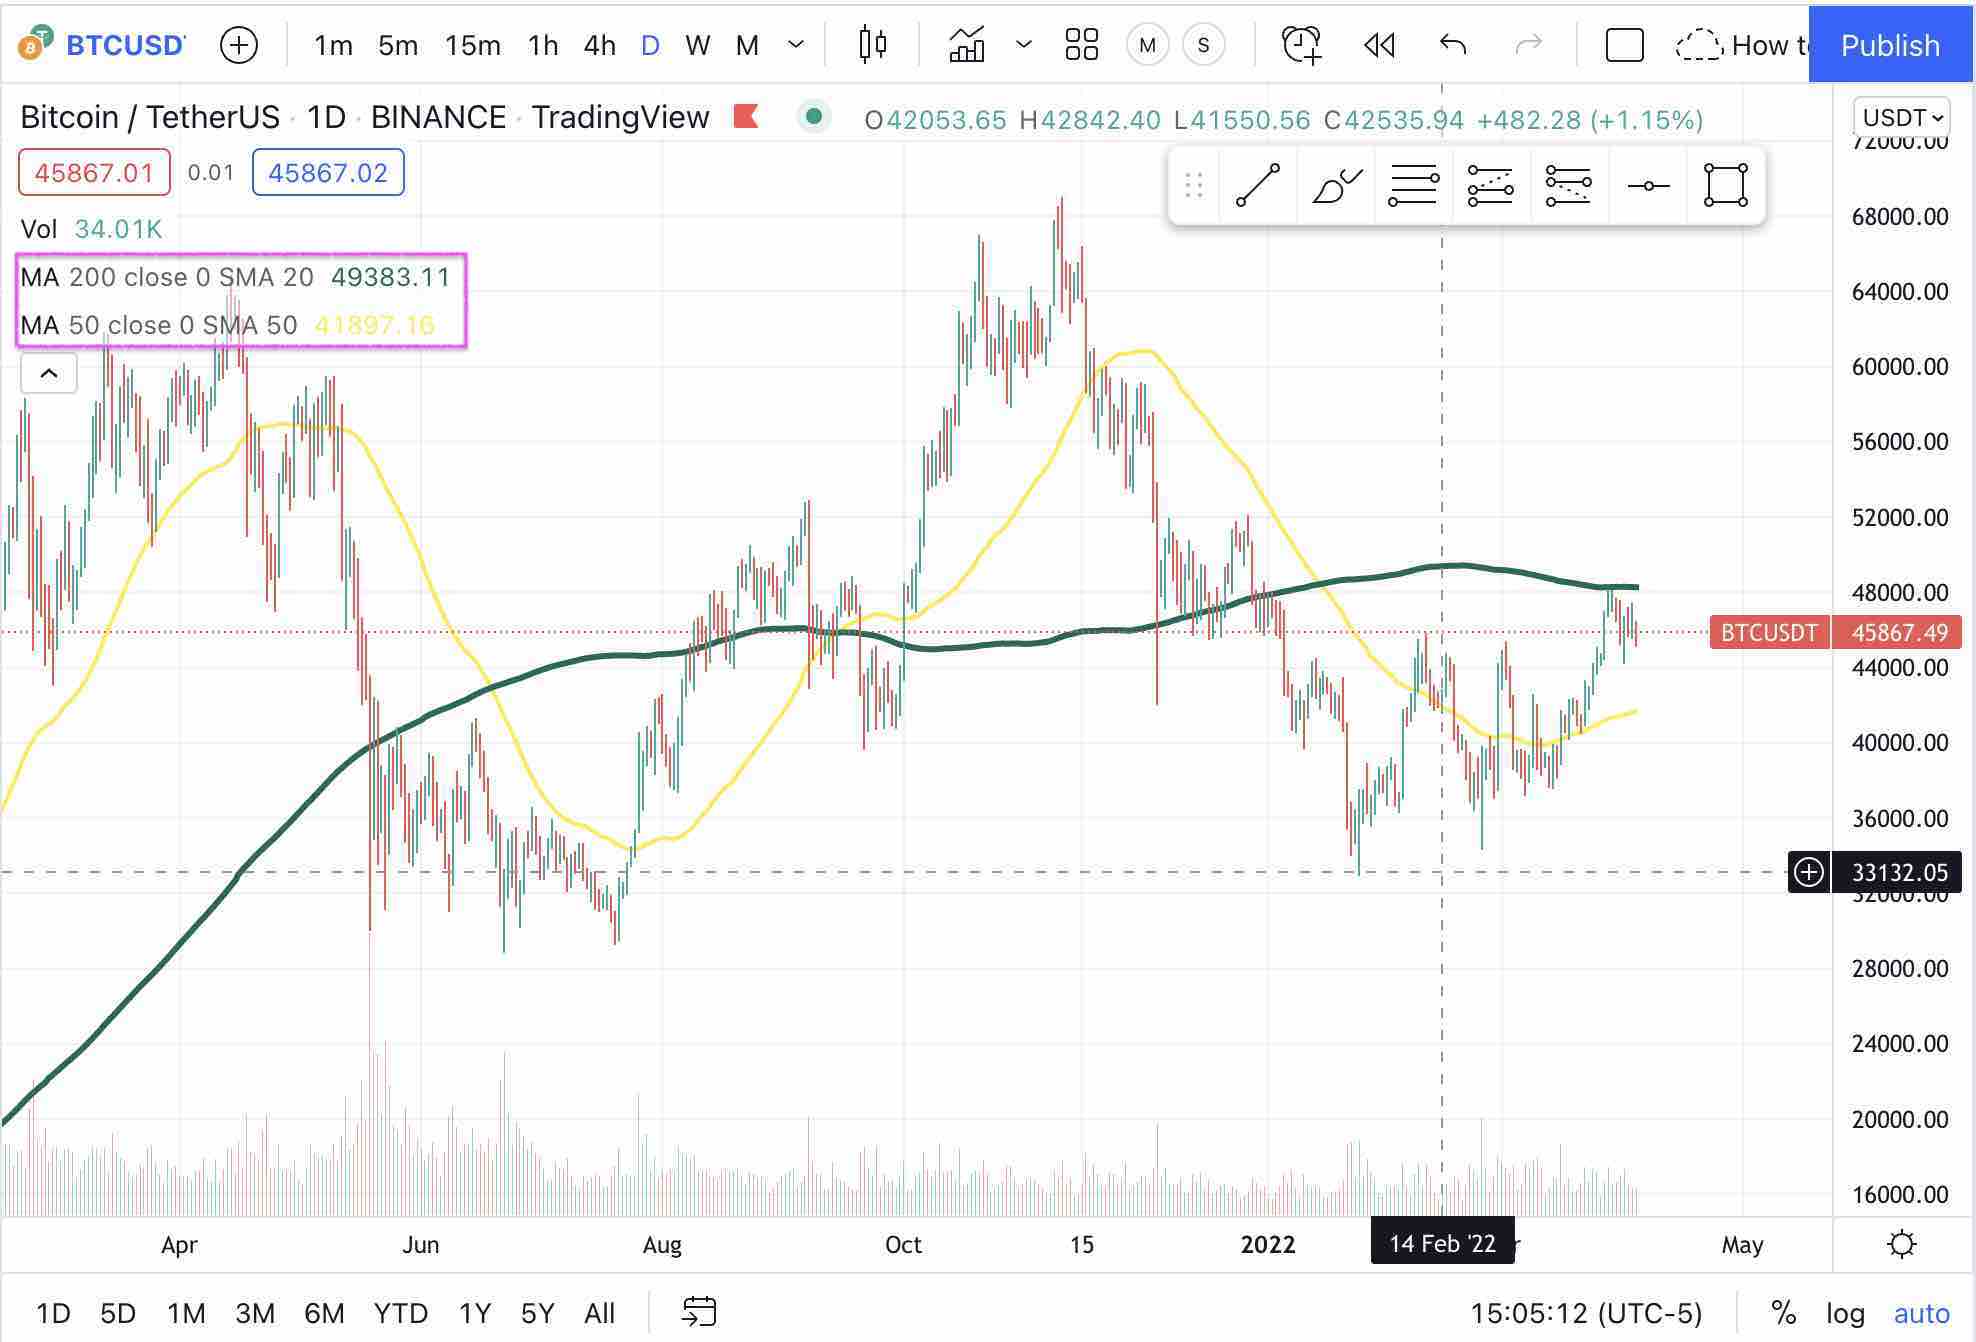
As you see in the chart layouts, we added two moving averages to get a feeling of the market trend. Now you are ready to go. The next step is to add your favorite assets to your own personal watchlist.
4. How to Create Your Own Watchlist
Now we want to choose our favorite cryptocurrencies that we want to analyze. That we do not have to look them up over and over again, we will create our first custom watchlist.
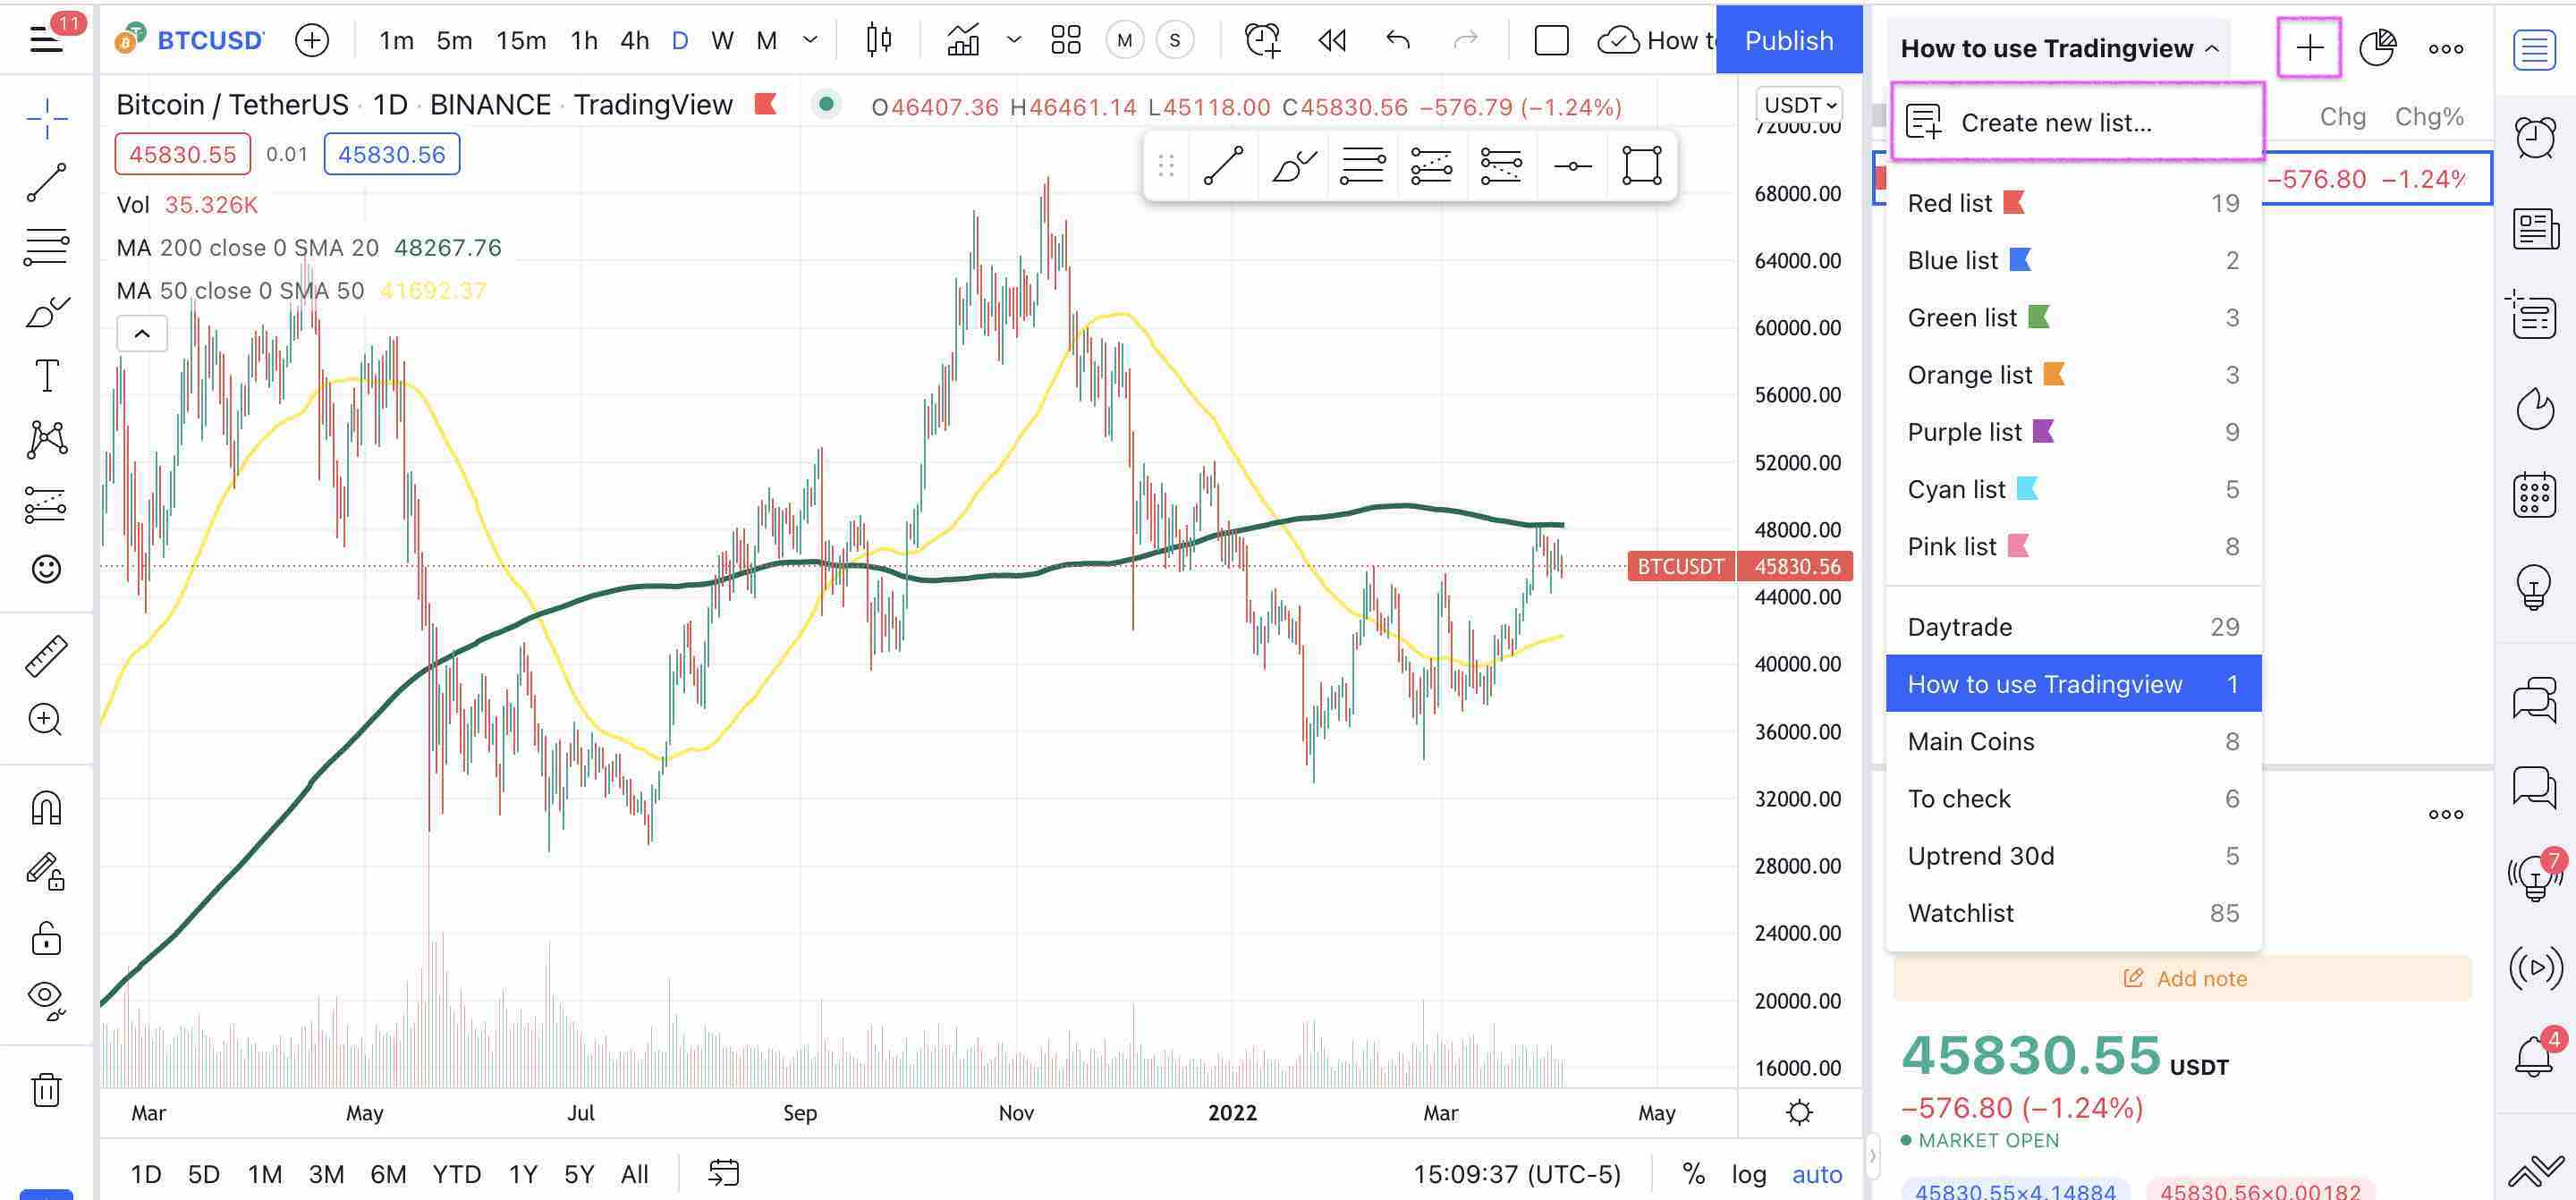
Just press create a new list, define a new one, and your list is ready to add the first asset.
Just press the plus sign and choose your favorite asset. We choose BTCUSDT. You can create as many lists as you want and add as many cryptocurrencies to each of those lists.
That's it; you are ready to dig deeper.
The Verdict
Millions of traders use Tradingview and exchange ideas, concepts, and strategies on their social networks.
In this Tutorial, I tried to explain how the Tradingview User Interface is organized, which features its offers, and how you can set it up for your personal needs. You should be ready to start experimenting yourself and set up your personalized charting tool on your favorite asset classes.
If you enjoyed Tradingview, you can signup here.
Enjoy yourself and stay weird!
Disclaimer
This website includes information about cryptocurrencies and other financial instruments. All these areas are complex instruments and come with a high risk of losing money. We are NOT giving financial or investment advice; this page is for educational and informational purposes only. Please be careful and make sure that you understand how these instruments work. Also, think about whether you can afford to take the risk of losing your money.
Weirdo.Rocks encourage you to do your own research before making any investment decision.


